Overview
Pods are the smallest deployable units in Kubernetes and critical to application functionality. Debugging pods helps ensure applications run smoothly, scale seamlessly, and use cluster resources effectively.

This article helps Kubernetes cluster administrators and developers diagnose and troubleshoot pod issues. After reading, you will be able to:
-
Inspect pod status in a cluster.
-
Analyze logs for debugging.
-
Execute shell commands within containers.
-
Use ephemeral containers for interactive debugging.
Estimated time: 30 minutes
Prerequisites
Before starting, verify that you have:
-
Access to a Kubernetes cluster with running pods.
-
Sufficient permissions to execute
kubectlcommands.
Debug pods in a Kubernetes cluster
The following sections describe common debugging techniques. Use these techniques sequentially or combine them based on your specific scenario.
Step 1: Check pod status
Begin debugging by checking the status of your pods.
To list all pods:
$ kubectl get podsTo list pods in a specific namespace:
$ kubectl get pods --namespace=<namespace-name>Example:
$ kubectl get pods --namespace=defaultExpected output:
NAME                                    READY   STATUS             RESTARTS   AGE
hello-node-7b87cd5f68-2wp4m             1/1     Running            0          21m
nginx-deployment-66b6c48dd5-8k4h2       0/1     Pending            0          5m
redis-master-58db8984f-xp4c8 0/1 ImagePullBackOff 0 2m|
Tip
|
If a pod is stuck in |
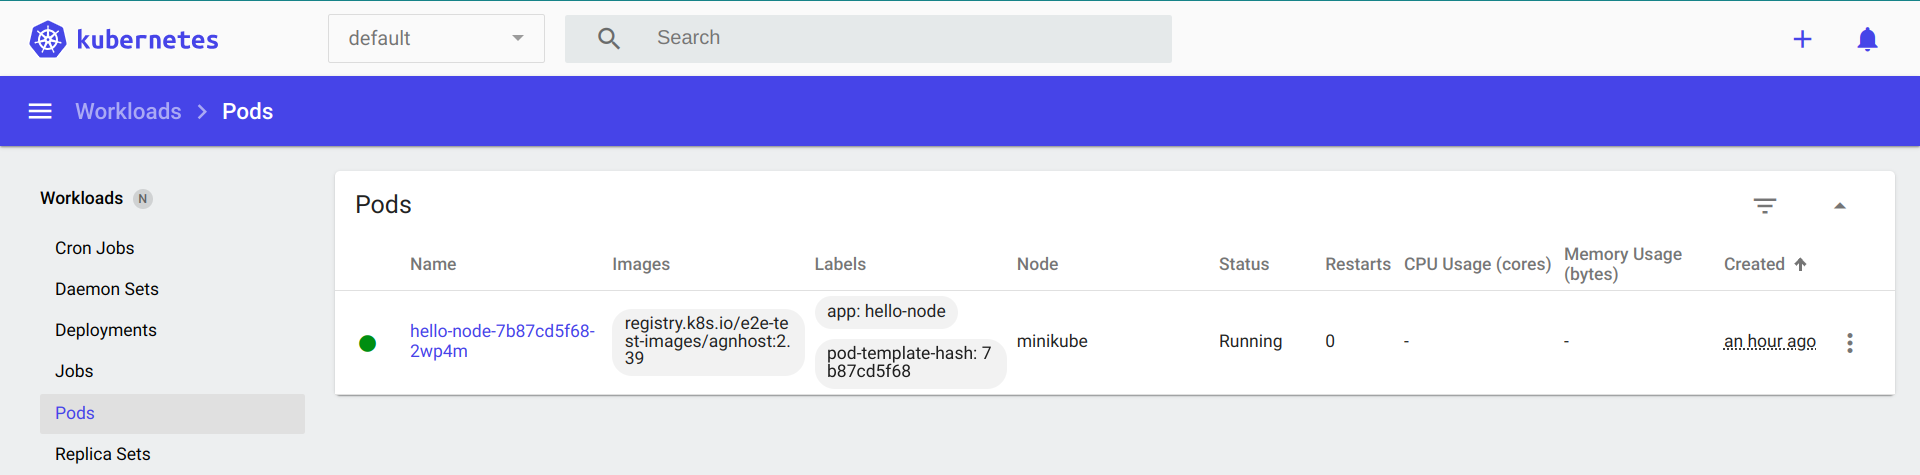
For a graphical interface, use the Kubernetes dashboard:
-
Open the Kubernetes dashboard.
-
Navigate to the Pods section.
-
Select a pod to view its details.
Step 2: Review pod logs
Logs help identify what a container is doing or why it failed.
To view logs from all containers in a pod:
$ kubectl logs <pod-name> --all-containers=trueTo view logs from a specific container:
$ kubectl logs <pod-name> -c <container-name>|
Note
|
For pods with a single container, omit the container name. |
Example:
$ kubectl logs hello-node-7b87cd5f68-2wp4mExpected output:
I0715 06:51:04.198447       1 log.go:195] Started HTTP server on port 8080
I0715 06:51:04.198572 1 log.go:195] Started UDP server on port 8081|
Tip
|
For pods in |
Step 3: Execute container commands
Inspect container state by running shell commands directly inside it.
Syntax:
$ kubectl exec <pod-name> -c <container-name> -- <command>|
Note
|
If not specified, commands run in the first container of the pod. |
Examples:
$ kubectl exec nginx-deployment-66b6c48dd5-8k4h2 -- envExpected output:
PATH=/usr/local/sbin:/usr/local/bin:/usr/sbin:/usr/bin:/sbin:/bin
HOSTNAME=nginx-deployment-66b6c48dd5-8k4h2
NGINX_VERSION=1.21.1
NJS_VERSION=0.6.1
PKG_RELEASE=1~buster
HOME=/root$ kubectl exec nginx-deployment-66b6c48dd5-8k4h2 -- curl -I localhost:80Expected output:
HTTP/1.1 200 OK
Server: nginx/1.21.1
Date: Tue, 14 Jan 2025 10:15:23 GMT
Content-Type: text/html
Content-Length: 612
Connection: keep-alive$ kubectl exec nginx-deployment-66b6c48dd5-8k4h2 -- ps auxExpected output:
USER       PID %CPU %MEM    VSZ   RSS TTY   STAT START   TIME COMMAND
root         1  0.0  0.1  10640  5548 ?     Ss   10:00   0:00 nginx: master process
nginx 31 0.0 0.1 11088 5164 ? S 10:00 0:00 nginx: worker process|
Tip
|
For containers that crash immediately, create a copy of the pod with a sleep command: |
Step 4: Use ephemeral debug containers
Ephemeral containers let you attach debugging tools to running pods without modifying the original containers.
To create an ephemeral debug container:
$ kubectl debug <pod-name> -it --image=<debug-image>Examples:
$ kubectl debug nginx-deployment-66b6c48dd5-8k4h2 -it --image=nicolaka/netshootExpected output:
Defaulting debug container name to debugger-nx8j2.
If you don't see a command prompt, try pressing enter.
~ # dig kubernetes.default.svc.cluster.local
~ # curl -v telnet://nginx-service:80
~ # tcpdump -i any port 80$ kubectl debug redis-master-58db8984f-xp4c8 -it --image=ubuntuExpected output:
Defaulting debug container name to debugger-7xj4d.
If you don't see a command prompt, try pressing enter.
root@redis-master-58db8984f-xp4c8:/# apt-get update
root@redis-master-58db8984f-xp4c8:/# apt-get install -y procps
root@redis-master-58db8984f-xp4c8:/# top
...Memory usage details...|
Tip
|
For pods with |